i-Ready logo.

i-Ready Online Instructional Usage Trends in Rhode island

< Back to Main Article

Here's What's Happening in Rhode Island

Early distance-learning data provides a window into the persistent equity gap and low-income students’ appetite for digital learning opportunities.

A Comparison of K–8 i-Ready Instructional Usage Pre- and Post-School Closures

Graph showing i-Ready usage before and during school closures.

Figure 1: Across the country, i-Ready usage dropped significantly in Week 1 of school closures. Since then, usage has shown some recovery. In Rhode Island, usage has shown more recovery than we’ve seen nationally.


A Comparison of K–8 i-Ready Instructional Usage Pre- and Post-School Closures by Median Income

Graph showing i-Ready usage before and during school closures in different income brackets.

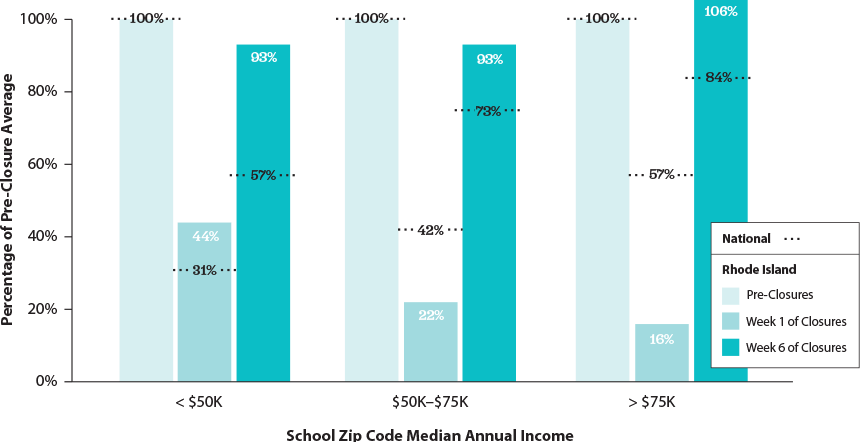
Figure 2: Nationally, students from low-income zip codes saw a much larger drop in usage than their peers in high-income zip codes. By Week 6, usage has shown some recovery, but the gaps persist among zip codes. In Rhode Island, the gaps are smaller than we’ve seen nationally.


Average Time Spent per Week in K–8 i-Ready by Median Income

Graph showing weekly time spent in i-Ready before and during school closures.

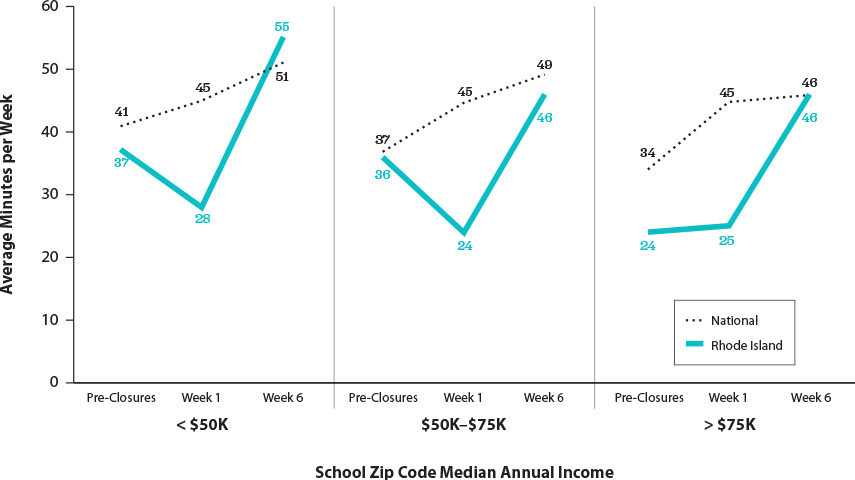
Figure 3: When Rhode Island students from low-income zip codes get access, they spend more time in i-Ready than their peers from higher-income zip codes.